Probability tables
Read, re-link and export the crop-success table extensionists share.
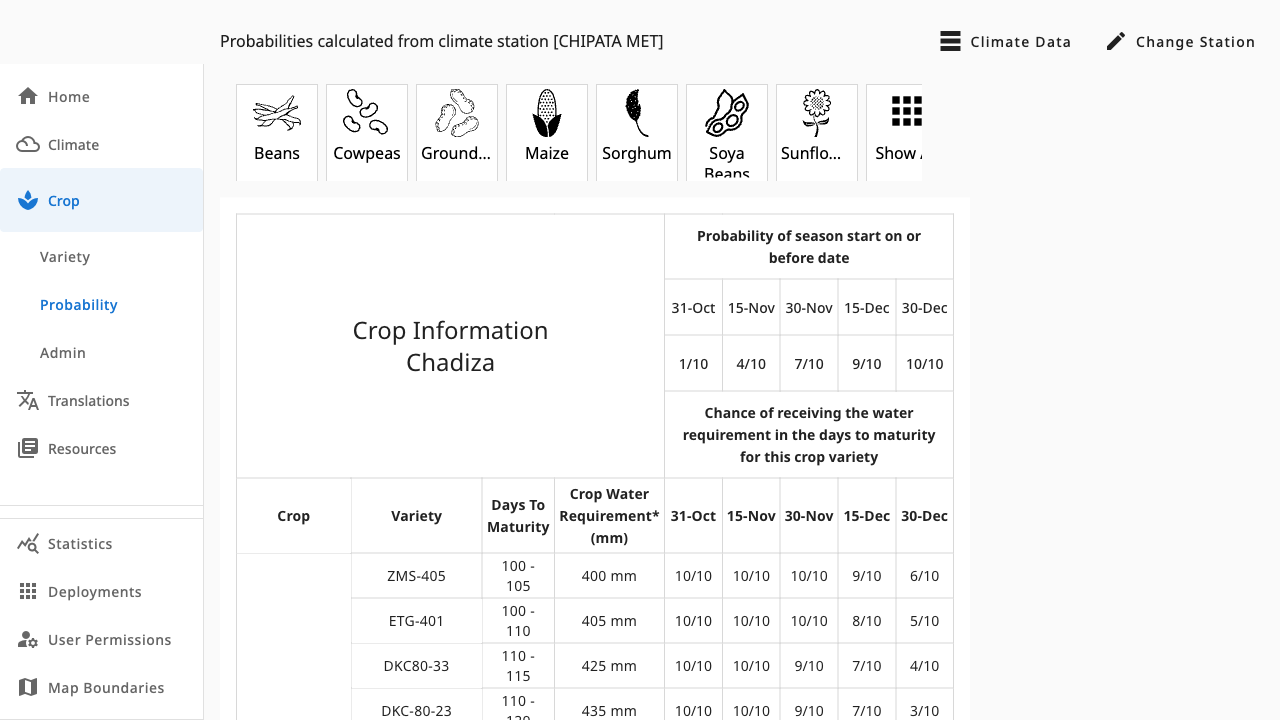
Each location's table shows, for every variety, the chance of receiving its water requirement when planting by a given date — the sheet extensionists share with farmers.
 1234
1234- 1Climate Data — jump to the linked station’s details
- 2Change Station — re-link the location to a different station
- 3Crop filter cards — narrow the table below to one crop
- 4Probability cells — e.g. 9/10 means success in 9 of the last 10 seasons
Reading the table
- The header shows the location, the linked climate station, and season-start probabilities per date.
- Each row is a variety with its days to maturity and water requirement; cells like
9/10mean success in 9 of the last 10 seasons. - The crop icons above filter the table to one crop.
Re-linking a station
If a location has no station — or the wrong one — Change Station opens a searchable station picker with a map. Updating re-links the location and recalculates the table.
Sharing
Below the table (scroll down) you will find Copy To Clipboard for pasting
into messages or documents, a language picker, and Export → Word, which
downloads a .docx in the selected language, ready to print or share offline.
Warnings at the top point to missing station data or missing water
requirements, with links to fix them.
The same tables are bundled into the field app, so corrections here flow to farmers after the next app data release.