Crops
Probability locations
Pick a location to see its downscaled crop probability table.
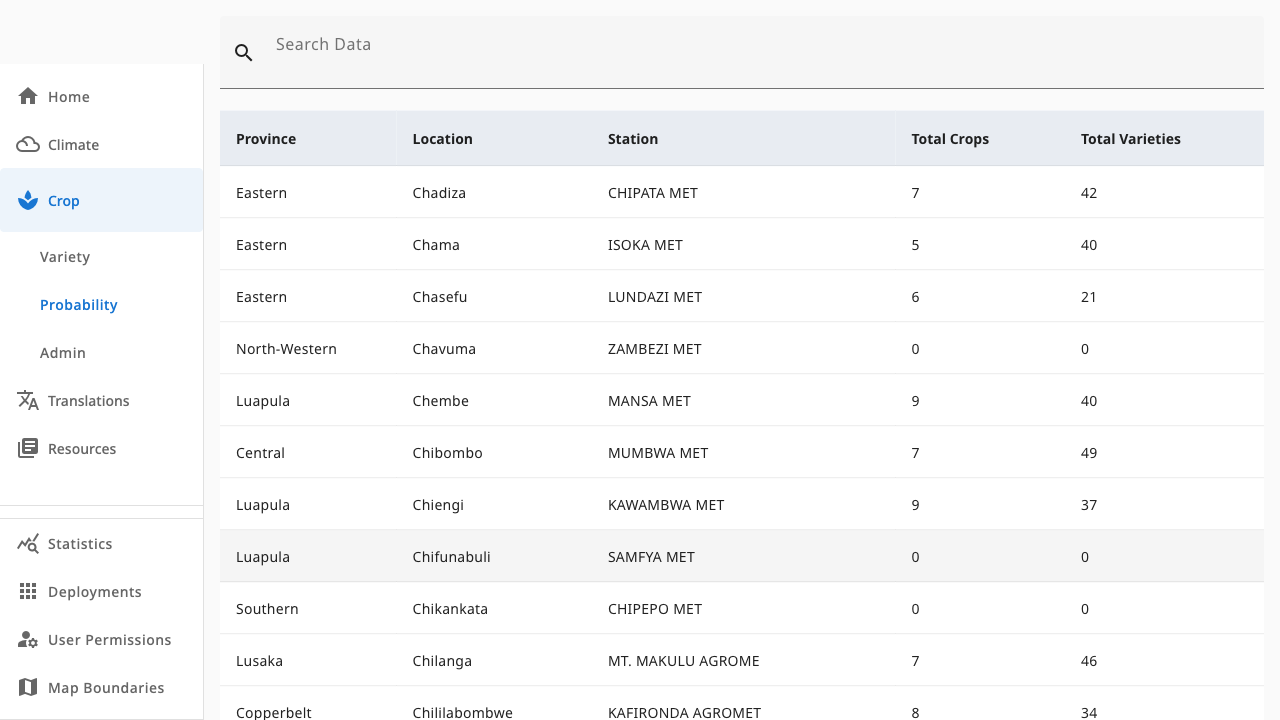
Crop → Probability lists every location with downscaled crop data: which climate station it is linked to, and how many crops and varieties have water requirements there.
 12
12- 1Location table — province, location, linked station and coverage counts
- 2Click a row to open that location’s probability table
Understanding the columns
| Column | Meaning |
|---|---|
| Location (and Province) | The administrative area, labelled from boundary data |
| Station | The climate station whose rainfall history powers the calculations |
| Total Crops / Varieties | How many crops and varieties have water requirements for this location |
Locations with low counts will show coverage warnings on their table — fix them by adding water requirements or importing data in Crop data admin.