Climate
Station details
Location, yearly data, charts and crop probabilities for one station.
Open any station from Station data to inspect its historical climate products. The page is organised into four tabs.
 12345
12345- 1Location tab — district, station name and coordinates summary
- 2Data tab — one row per year with pagination and CSV download
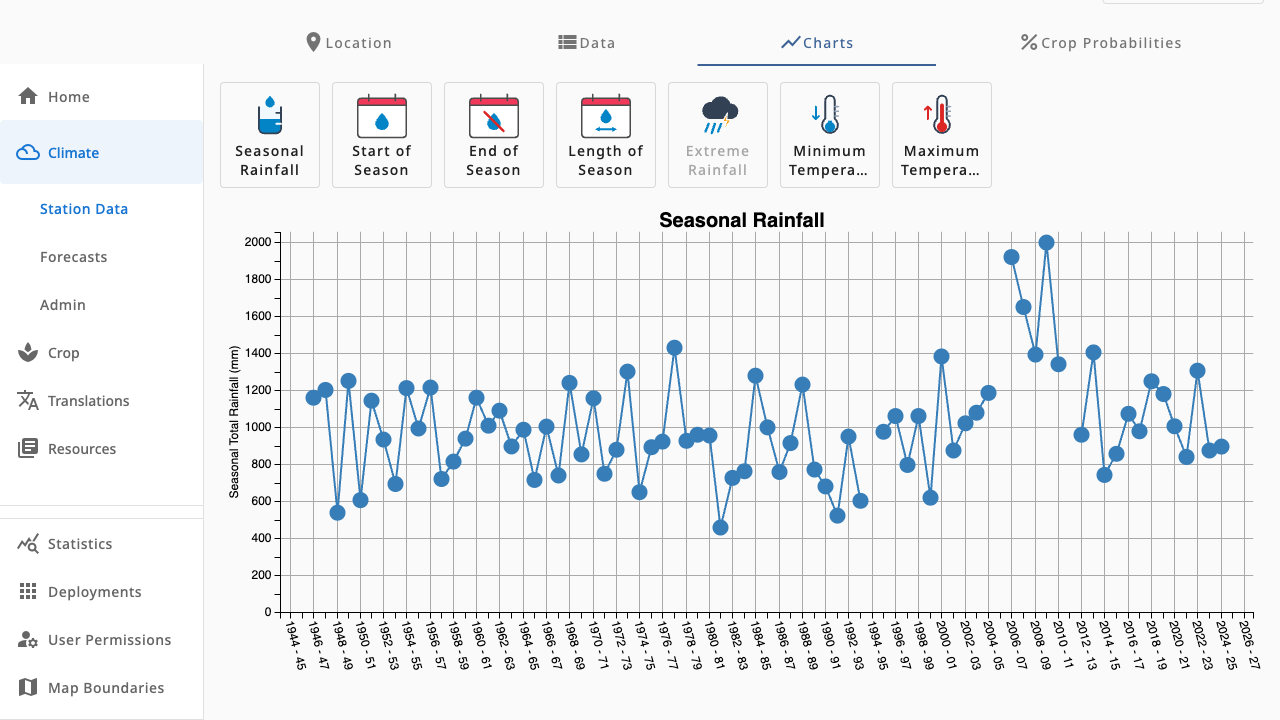
- 3Charts tab (shown) — the active tab rendering the chart below
- 4Chart picker — cards for seasonal rainfall, season timing, extremes and temperatures
- 5Crop Probabilities tab — planting-date slider with grid and table views
The four tabs
- Location — district, station name and coordinates summary.
- Data — one row per year (season start/end/length, rainfall totals) with pagination and a CSV download named after the station.
- Charts — visual summaries such as Seasonal Rainfall, Start/End/Length of Season, Extreme Rainfall and Min/Max Temperatures. These mirror what farmers see in the field app.
- Crop Probabilities — success probabilities per planting date, with a slider to pick the planting date and Grid/Table views.
Refreshing a station
Refresh Data pulls the latest summaries (annual rainfall, crop probabilities, annual and monthly temperatures) from the climate API. A status dialog shows each product succeeding or failing, so a partial failure is visible rather than silent.
Changed data only reaches the field app once the bundled app data is regenerated — admins verify this in Climate data admin.